Community Water Company of Green Valley (CWC) is a non-profit public service corporation serving customers in Green Valley and Sahuarita for over 40 years. In July 2015, CWC filed a rate case with the Arizona Corporation Commission (ACC). As part of that filing, they argued that ongoing declines in per-customer water demand would likely continue and requested that this trend be reflected in their new rates.
ACC staff initially rejected this part of CWC’s rate request, stating that recent declines in demand could be due to random variations or temporary factors, such as climatic fluctuations. The ACC had previously rejected similar requests by other water utilities.
CWC retained Montgomery & Associates (M&A) in December 2015 to perform a more thorough analysis of their declining demand. This included a time series analysis of CWC’s historical demand and updating a dynamic simulation model of residential demand that M&A had previously built for them. In addition, a cross-sectional analysis compared CWC’s demand with nine other municipal water providers across Arizona for whom M&A had built demand models. Finally, econometric analysis was used to test the theory that CWC’s recent demand reductions might be caused by climatic fluctuations.
The results of these analyses were that CWC’s declining demand was long-term, forecast to continue, and not caused by random factors or climate fluctuations. We also demonstrated that the falling demand experienced by CWC is far from unusual; in fact, it has become the norm. Water use in the US has been declining for decades, across all water use sectors – municipal, agricultural, industrial, and energy. Total groundwater and surface water withdrawals peaked in 1980 and have been declining ever since, nationally and for all regions of the country (see Figure 1). 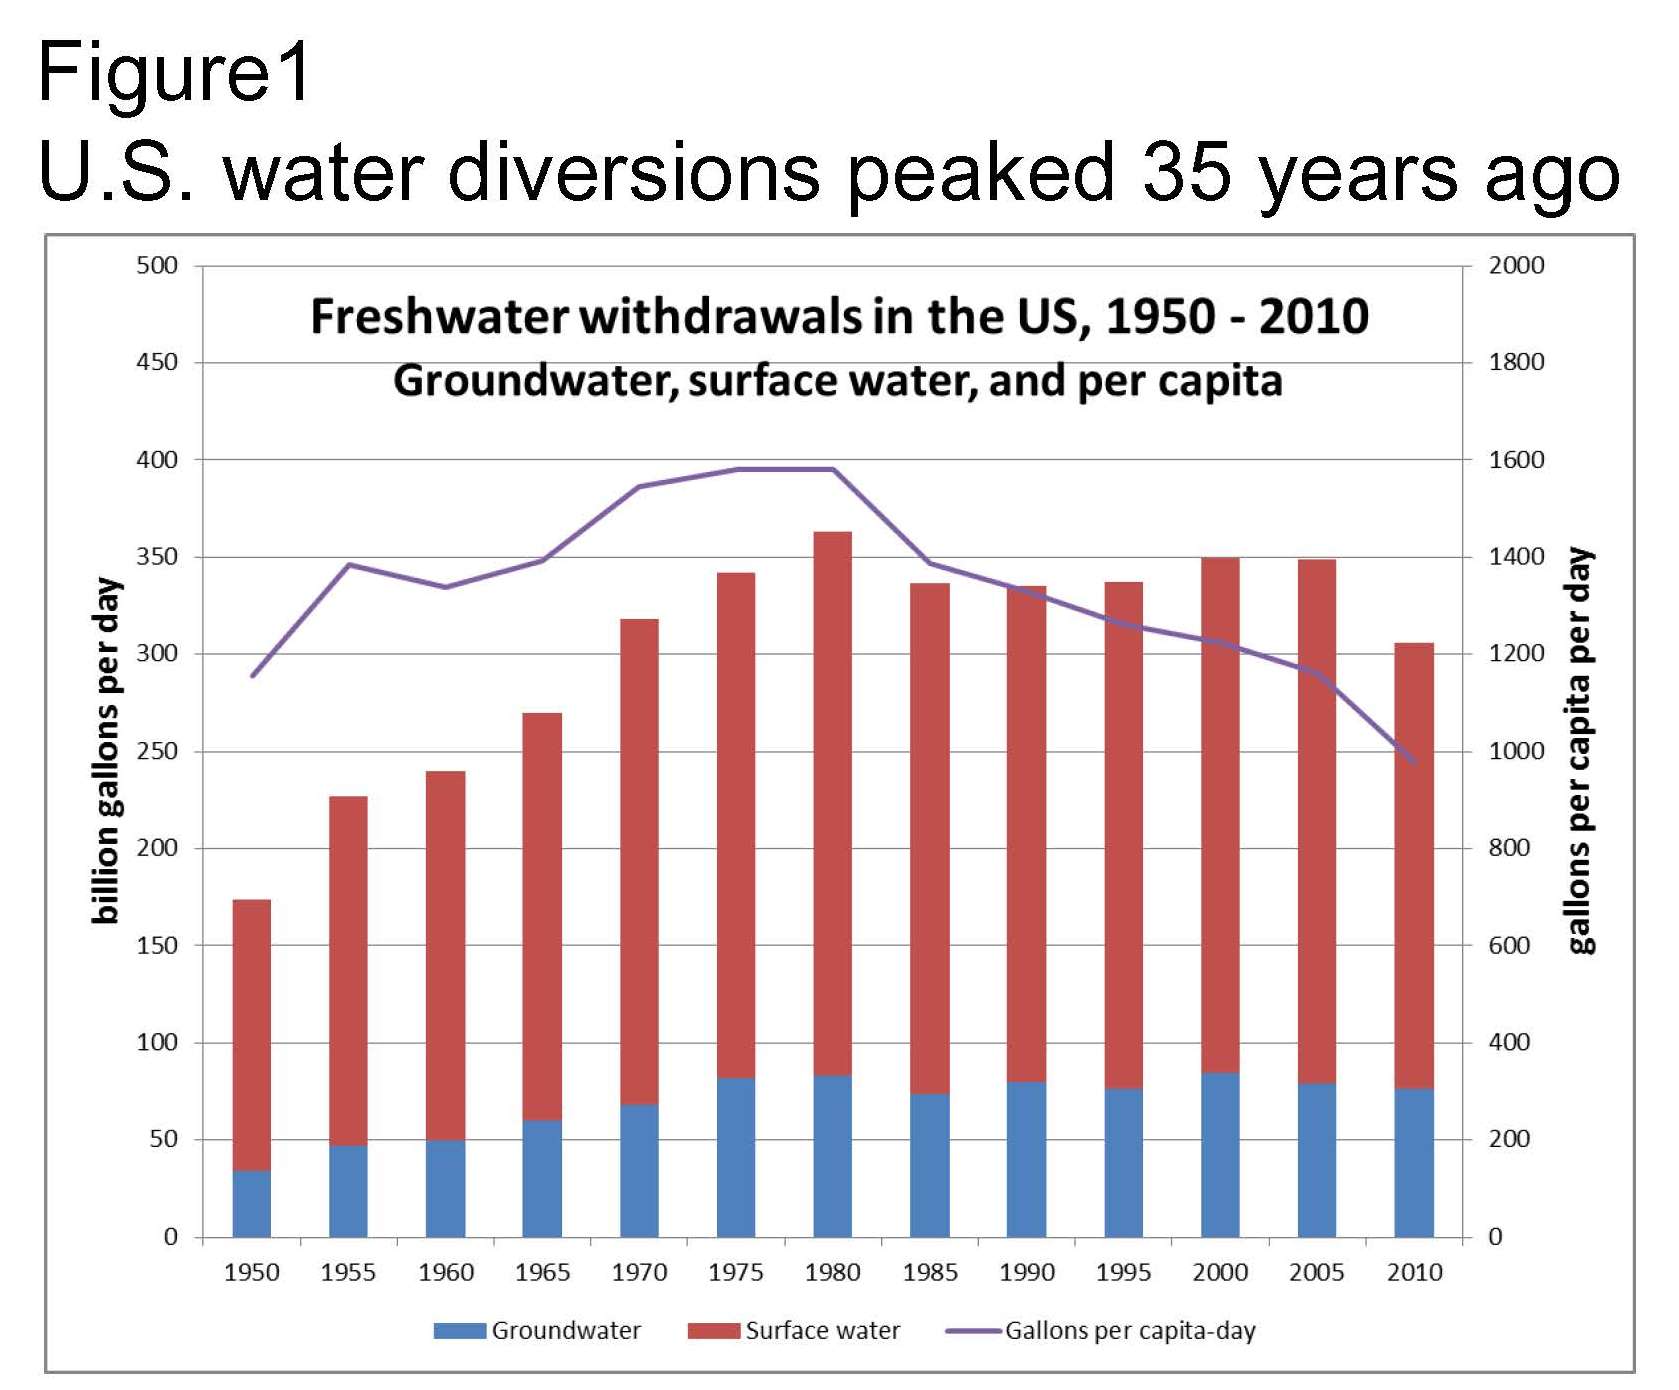
Water use for all activities peaked at nearly 1,600 gallons per capita per day (gpcd) in 1980; by 2010, rates were under 1,000 gpcd.[i] The surprising, but inescapable conclusion is that water demand is no longer tightly tied to population, economic output, or quality of life.
The downward trend in municipal demand spans the West, and has been particularly robust in Arizona. Research by M&A on municipal water use in Maricopa and Pima Counties revealed significant declines in residential water use between 2000 and 2015 in 10 of 11 providers studied (see Figure 2).[ii]
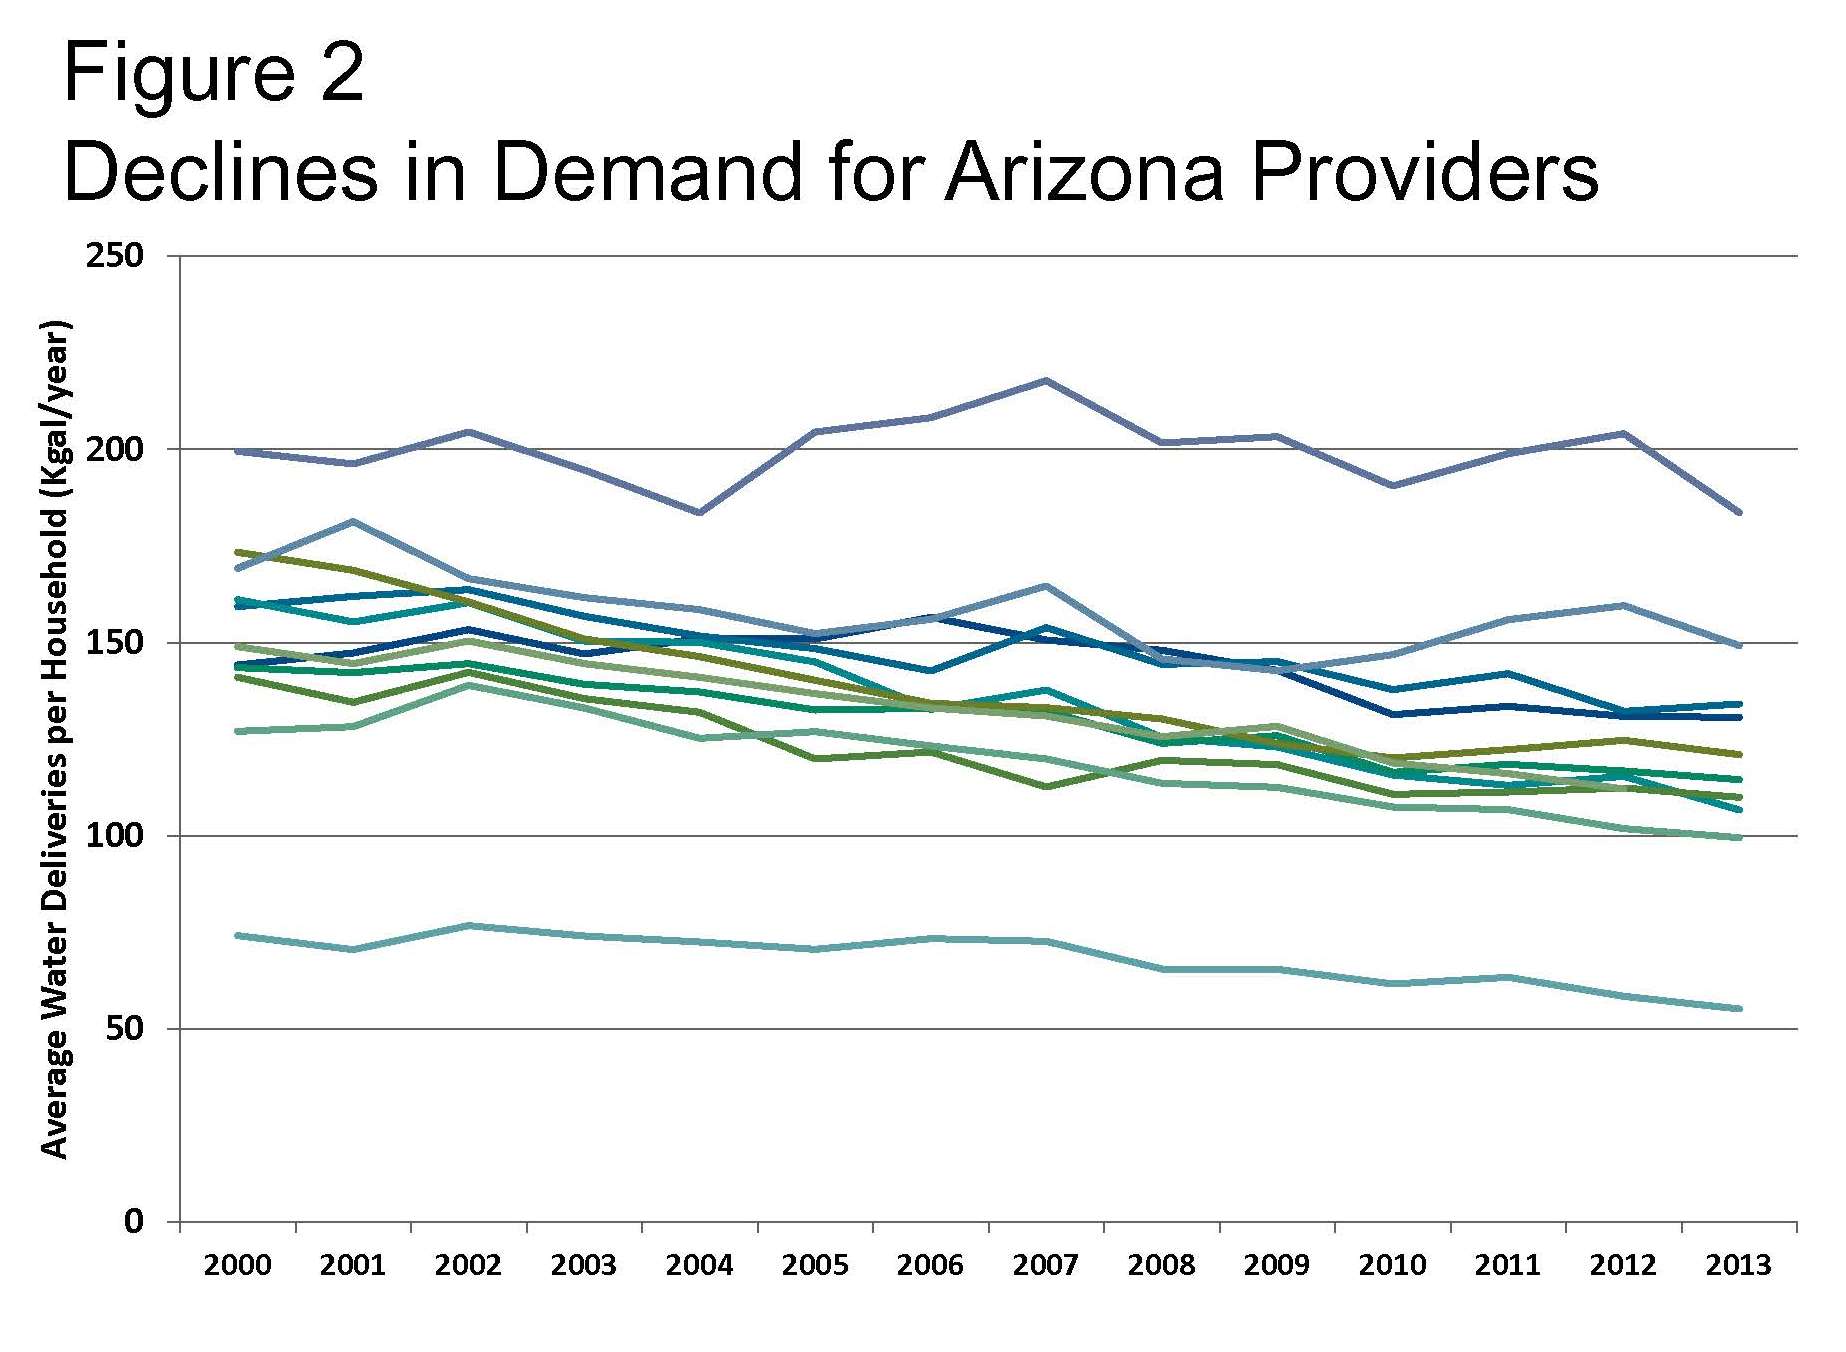
In most cases, declines in per-household demand have more than offset increases in demand from growth, meaning that total deliveries of water have been dropping, even as service area populations have grown. Declines in total deliveries across Arizona’s major metro areas have averaged 2.0% – 2.5% per year. In one striking example, Tucson Water delivered the same amount of potable water in 2016 as in 1985, despite more than a 70% increase in customers. Five main factors are driving these declines in municipal water demand:
- Indoor demand is being reduced by the gradual replacement of older fixtures and appliances, as they reach the end of their useful life or due to remodeling, with new, more efficient ones;
- Outdoor demand reflects changing tastes and preferences and shifting socio-demographics, which has resulted in wholesale removal of irrigated turf and installation of more drought-tolerant landscaping;
- New homes have more water-efficient fixtures and appliances than the existing housing stock, and are far less likely to have irrigated turf or swimming pools;
- Federal voluntary standards like WaterSense and Energy Star have driven manufacturers to produce more efficient appliances and fixtures. California, Texas, and Colorado have made these standards mandatory, affecting what is sold in big box stores across the West;
- Local conservation efforts, including education, rebates, and ordinances have created markets for, and hastened the acceptance of, highly water-efficient devices and landscapes.
These factors driving down municipal water demand are forecast to continue. All this increased water use efficiency sounds like good news for a semi-arid state like Arizona. And overall, it is. But there can be unintended consequences, particularly if reductions in demand are not anticipated or planned for. These include:
Fiscal Consequences
- revenues drop more than expenses
- conservation-oriented rate designs exacerbate the problem
- budgeting uncertainties
Operational Issues
- longer “water age” impacts residual disinfectant levels and disinfection by-products
- less reclaimed water available than anticipated
- uncertainties as to available unused system capacity for wastewater plants
Planning Challenges
- optimal timing of capital improvements
- acquisition of new supplies
- design of water conservation programs
- rate setting
Public Perception Issues
- water conservation blamed for rate hikes
- people feel they’re being punished for conserving
The public perception issues – that customers are being punished with higher rates for conserving – is being refuted by studies showing avoided costs for infrastructure result in lower water rates [iii]. Here, we discuss the fiscal consequences of long-term declines in demand.
Water utilities generally have substantial fixed costs and much smaller variable costs, mostly consisting of energy and chemicals. For CWC, fixed costs are roughly 85% of total costs, and as much as 92% at the margin. Thus, if demand were to fall by 5% over a period of a couple years, costs would fall only about 1%. Revenues, however, would fall much more. CWC’s revenues are split roughly equally between fixed fees and commodity charges, which means a 5% drop in demand would reduce revenues by 2.5%. Many municipal providers in Arizona receive significantly more than half their revenues from commodity charges. Revenues can drop even more due to increasing block rates, as customers using less water fall into lower block rates.
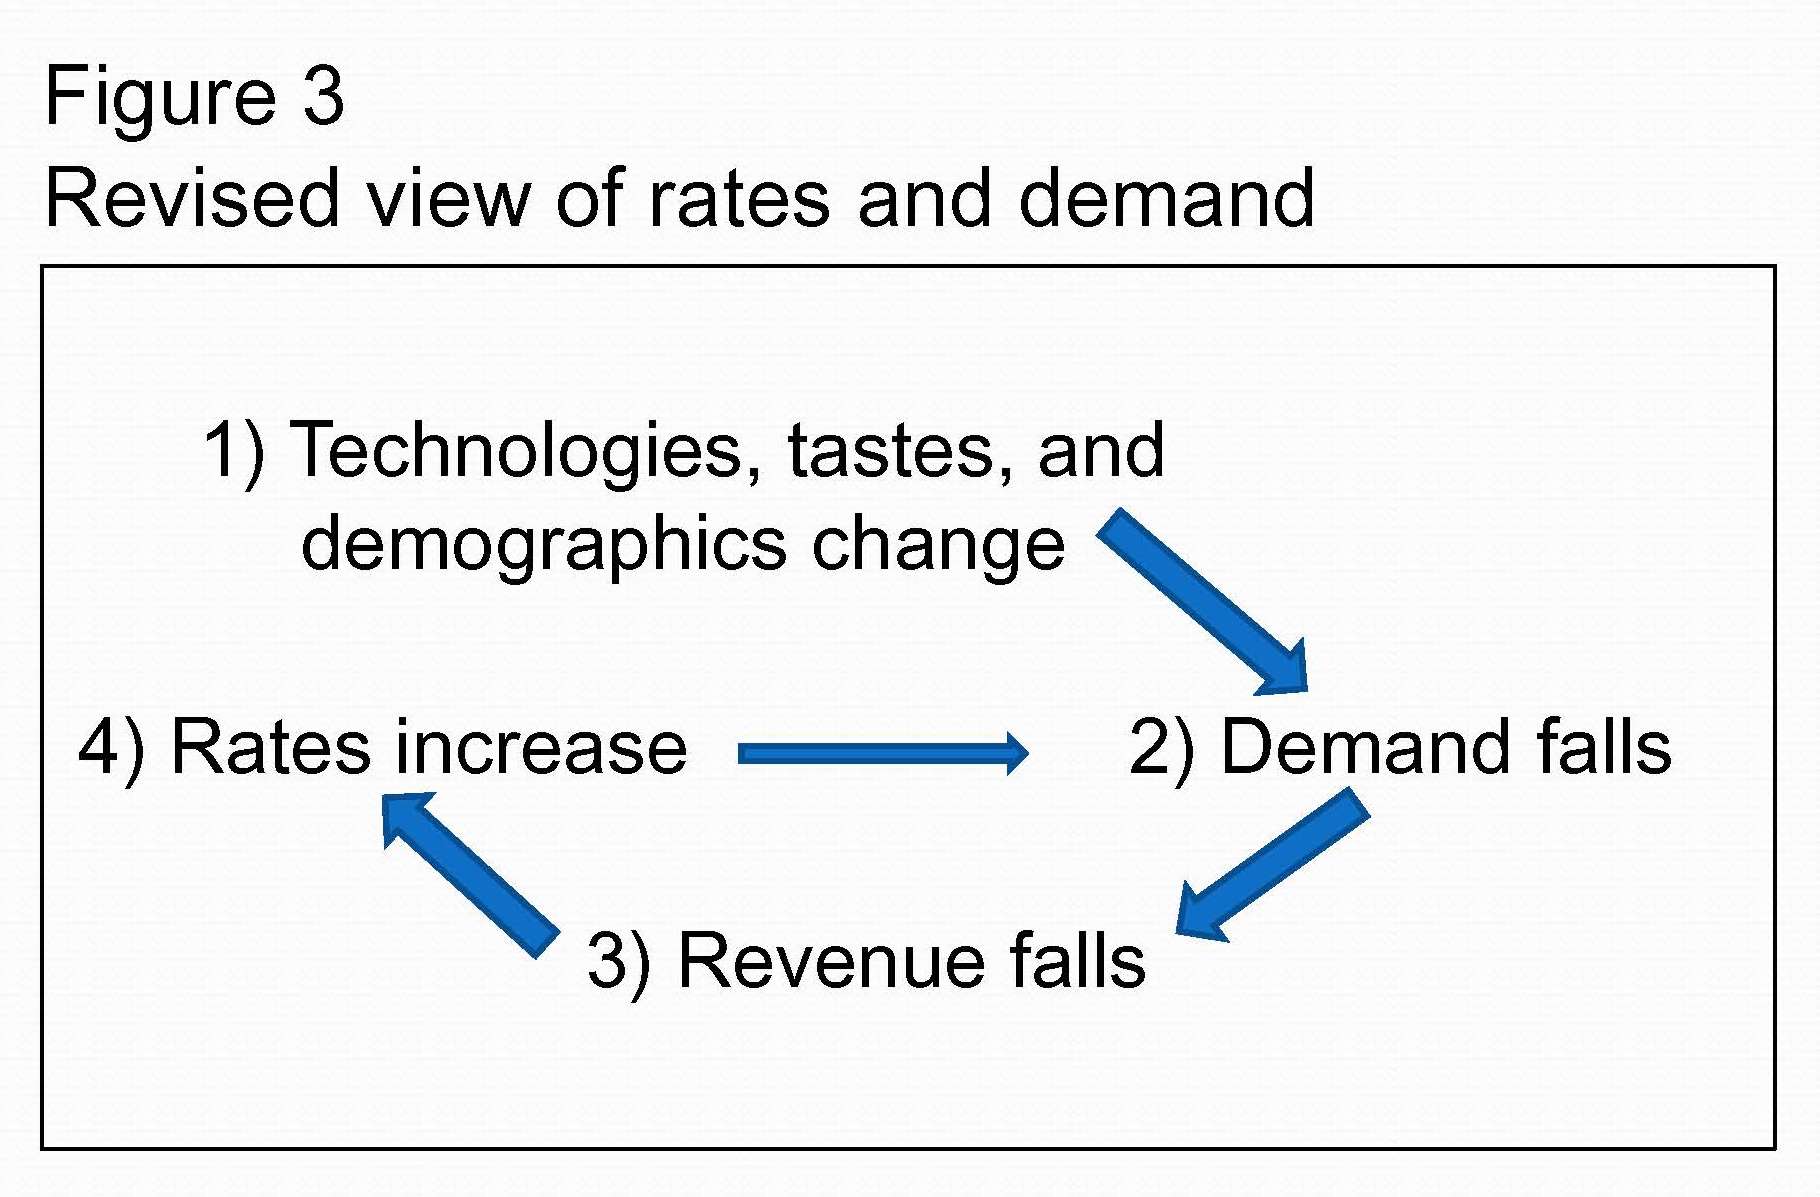
The result is a continual need to raise water (and sewer) rates to offset declines in revenue. This conclusion, coupled with the analysis of the causes of long-term declines in demand, challenges the traditional view of rate increases driving down demand. Instead, the other factors enumerated above are principally responsible for decreases in demand, which causes net revenues to fall, resulting in the need to raise rates (Figure 3). These ongoing reductions in net revenue can be particularly acute for providers regulated by the ACC, where new rates often do not take effect until two years after the test year.
Upon submittal by CWC of its rebuttal testimony in March 2015 on why declines in demand were highly likely to continue, ACC staff recommended that the new rates account for the impacts of long-term declines in demand. The administrative law judge adopted staff’s recommendation, and rates reflecting the forecast reductions in demand were approved by the ACC commissioners, with new rates taking effect in September 2016.
Operational and planning challenges associated with declining demand still exist. However, the ACC’s recognition of these declines in rate setting is a significant and positive step in helping Arizona’s utilities deal with the fiscal implications.
This HydroNote is an excerpt of an article published in the Winter 2018 issue of the Kachina. The Kachina, is a quarterly journal published by AZ Water, which is the Arizona chapter of the American Water Works Association.
[i] U.S. Geological Survey, 2014, Estimated Water Use in the United States in 2010, Circular 1405.
[ii] Montgomery & Associates, 2015, Maricopa County Residential Water Demand Study, August 2015.
[iii] See for example two reports: Water Conservation Keeps Rates Low in Gilbert, Arizona, and Water Conservation Keeps Rates Low in Tucson, Arizona, both studies by the Alliance for Water Efficiency, June 2017.